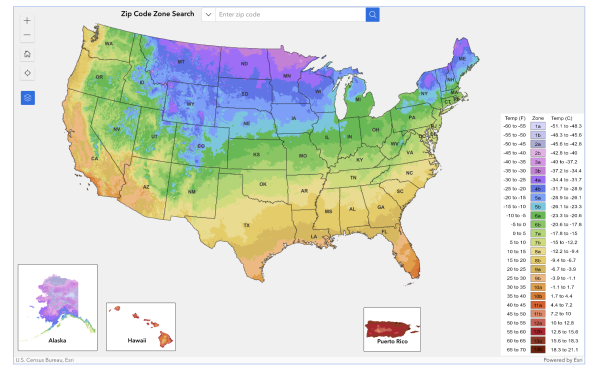
The U.S. Department of Agriculture (USDA) released a revised version of its Plant Hardiness Zone Map, the first such update since 2012.
The backsides of seed packets will never be the same. Gardeners, landscapers and others refer to the zones on seed packets to decide whether or not a plant is likely to thrive in their geographic area.
The 2023 version of the map shows about 50% of zones shifting to the next warmer one. This indicates that these areas warmed up somewhere between 0 to 5 degrees Fahrenheit over the past 11 years.
According to the USDA press release that announced the news, the new map is more accurate and contains greater detail than prior versions. The 2023 map incorporates data from 13,412 weather stations compared to the 7,983 that were used for the 2012 map.
The hardiness zones are based on the average annual extreme minimum temperatures over the past 30 years. The annual extreme minimum temperature represents the coldest night of the year, which can be highly variable from year to year, depending on local weather patterns. The USDA noted in their announceent that the zones do not suggest these are the lowest temperatures ever recorded in these areas, nor the coldest temperatures that might occur in the future.
Here’s the Zones for the Four Largest Texas Cities and their lowest temperatures
- CHANGED Dallas–Zone 8b, 15-20 degrees (from 8a)
- CHANGED Houston–Zone 9b, 25–30 degrees (from 9a)
- NO CHANGE San Antonio–9a, 20 – 25 degrees
- CHANGED Austin–9a, 20-25 degrees (from 8b)
Thirteen hardiness zones comprise the map across the United States and its territories, with each zone broken into half zones, designated with an “a” or “b” following the zone number. For example, Zone 5 is divided into 5a and 5b half zones.
Want to check your hardiness zone? Check out the map and put in your zip code here.
Related posts:
- It’s official: Warmer winters cause USDA to revise plant zones
- Ice storms, drought, extreme heat decimate Texas tree canopy
- Diminished monarch migration moves slowly through Texas into Mexico
- IUCN revises listing of monarch from “endangered” to “vulnerable”
- Monarch migration underway as new studies suggest butterflies are “not in danger”
- Q & A : Migration studies expert Andy Davis says, for monarchs, it’s survival of the biggest
- Recent IUCN “endangered” listing creates confusion for monarch butterfly followers
- Eastern monarch population up 35% this year, but still much work to do
- Dejavu: is 2022’s dry spring setting the stage for another Texas drought like 2011?
- They’re here! Drought conditions greet monarch butterflies as they arrive in Texas
Like what you’re reading? Don’t miss a single post from the Texas Butterfly Ranch. Sign up for email delivery, like us on Facebook, or follow us on Twitter, @monikam or Instagram.


Interesting…..I have twenty monarch caterpillars in a cloud condo, munching away.
I also raise monarch butterflies here in SWFL. I use the towers to find caterpillars and let them grow into monarchs and then release them onto the flowers.
I’m deep into Excel, collating LCRA temperature data for the last two decades at stations the USDA moved to a warmer zone. Looking at real, historical extreme cold temperatures each winter, while there has been some warming I would recommend people do not plant for a warmer zone, as extreme cold temperatures most years reflect the old hardiness zone. Nor does the new map suggest temperatures have warmed over the last 11 years. It means that average extreme cold temperatures from 1991 to 2020 have warmed. That’s a different conclusion. Also, the datasets used to produce the last USDA hardiness map vary somewhat from those used for the new map. Without diving into the PRISM system to know exactly what code and algorithms have changed, it’s somewhat an apples to oranges comparison.
This is good info thanks for sharing
Yay.